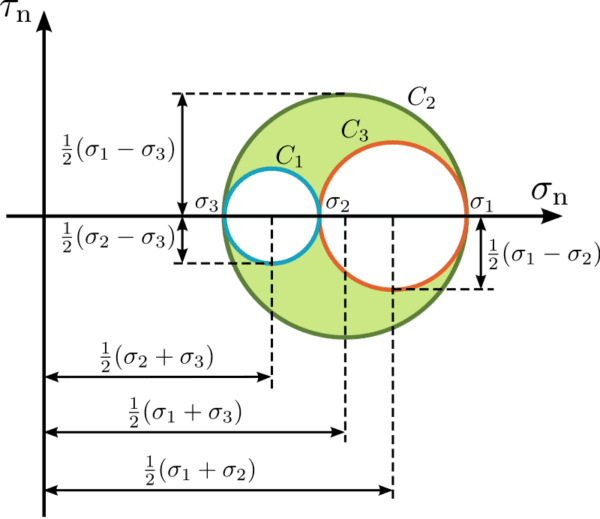
Mohr’s circle provides a fundamental visualization tool for performing complex stress and strain transformations vital within civil and mechanical engineering applications.
Originated by mathematician Otto Mohr, the technique converts three-dimensional states of stress or strain into a graphical format enabling convenient calculation of principal values, orientations and more.
Mohr’s circle uniquely transforms complex two-dimensional stress tensors into a simple yet powerful representation – revealing principal stresses, maximum shear stresses, and failure susceptibilities for varied oblique planes from a single circular signature.
By leveraging geometric interpretations rather than convoluted tensor mathematics, Mohr’s methodology empowers engineers to quickly calculate stresses, compare 3D states, and design for strength or stability across any orientation.

Its elegance has transcended into contemporary software tools for automated generation after finite element solutions.
Constructing Mohr’s Circle for Plane Stress Scenarios
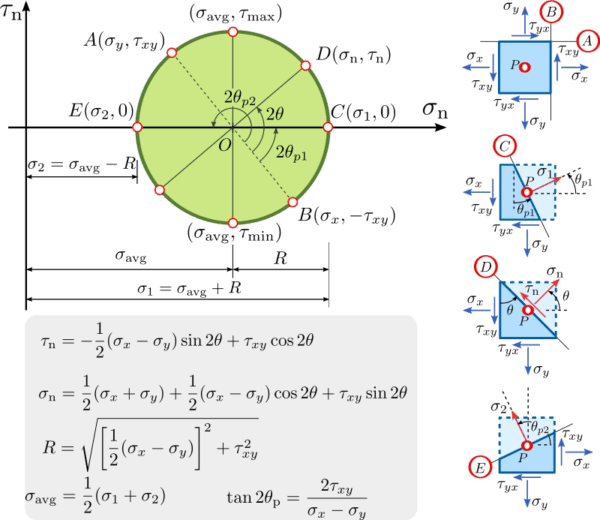
Known planar stresses get plotted as a point scale. A circle drawn centered on the σx-axis and radius R gives principal normal stress values σ1, σ2 at circle intersections with σx-axis. R obtains through Mohr’s circles formulas using the stress components.
the following are the steps to construct the Mohr circle for the state of stresses at 
- Draw the Cartesian coordinate system with a horizontal axis σnand τn on vertical axis (σn ,τn)
- Plot two points A (σy, τxy) B (σx ,τxy) in the (σn ,τn) and space corresponding to the known stress components on both perpendicular planes A and B respectively following the chosen sign conversion.
- Draw the diameter of the circle by joining points and with a straight line
- Draw the Mohr Circle. The Centre O of the circle is the midpoint of the diameter line AB, which corresponds to the intersection of this line with the
axis.

After a stress analysis, the stress components 


Generating Mohr’s Plot From Experimental Strain Rosette Data
Strain rosettes installed on a structural element record directional strain. The principal gauges 45° apart help transform the strain tensor into Mohr’s space. This facilitates determining principal strains as circle coordinates.
Calculating Maximum Shear Strain via Mohr’s Methodology
The circle’s central point displacement along σx-axis equals the maximum shear strain γmax. This proves useful for shear-critical designs. Circle minor principal axes projections also give shear stresses like τxy.
Identifying Principal Stresses From a Mohr’s Circle Plot
A Mohr’s circle features principal normal stress coordinates σ1, σ2 as farthest intercept points along itsσx-axis. Since σ1 > σ2 by convention, σ1 gets labeled on the greater absolute circle intercept. Sign convention applies for tension (+) /compression (-).


Associating Mohr’s Circles with Failure Theories
Relating circle principal stress coordinates to failure envelopes like Von Mises or Tresca criteria enables determining if stresses induce material yielding. This facilitates design limits.
Determining Maximum Shear Stress via Mohr’s Method
The absolute maximum shear stress τmax equals the circle radius R value through Mohr’s relationship. This helps assessing if shear failure modes activate.
The maximum and minimum shear stresses correspond to the ordinates of the highest and lowest points on the circle, respectively.
These points are located at the intersection of the circle with the vertical line passing through the center of the circle, 
Thus, the magnitude of the maximum and minimum shear stresses are equal to the value of the circle’s radius
Tensor Transformations to Map into Mohr’s Space
Tensors depicting stress/strain states in 3D get converted into Mohr’s cylindrical coordinate space. This allows Circle visualization for analysis.
Understanding Formulas Defining Mohr’s Circle Radii
The radii derive from middle principal stress σ2 disappearing in planar cases. R then depends only on major-minor principal stress difference divided by 2. Radius expresses shear stress state severity.
Modern Software Automating Mohr’s Analysis
Programs leverage matrix manipulation techniques to instantly construct Mohr’s Circles from stress-strain tensors across large FE models. This enables accelerated data evaluation.
Engineers continue harnessing Mohr’s fundamental methodology for revealing internal material stress-strain state intricacies through an intuitive circular format aiding critical design decisions.
This draft post walks through key facets of leveraging Mohr’s circle across civil engineering workflows from plotting steps to enabling software capabilities. Please suggest any modifications.


