The compression stress-strain curve is a fundamental graph used in civil engineering for analyzing the behavior of structural materials like concrete, steel, soil and more when subjected to compressive loading forces.
A stress-strain curve graphs the relationship between compressive stress, measured in units like psi or MPa, on the y-axis, and compressive strain, as a ratio or percentage, on the x-axis.
Compressive stress is applied to specimens like concrete cylinders or steel samples in a controlled test using a compression test machine.
The stress-strain curve resulting from a compression test is arguably one of the most important graphical relationships used in many engineering applications.
By graphing how a material specimen, like concrete or steel structural elements, reacts under a gradually increasing compressive load, we can analyze and predict its behavior in the built environment.
A material’s stress-strain signature reveals key properties like stiffness, ductility, ultimate strength, and more vital for structural integrity assessments and designs.
A stress-strain diagram plots the compressive stress acting on the test sample against the resulting compressive strain or relative deformation throughout different loading stages.
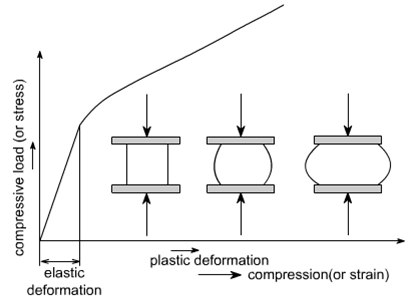
While stress is tracked via the recorded loading force over the specimen cross-section area, specialized instruments like strain gauges or extensometers directly measure strain.
Complex machines precisely generate the compression load and acquire test data.
Stress-strain curves allow classifying materials from brittle to ductile based on the observed failure modes.
Signatures can dramatically differ whether testing concretes, metals, timber, plastics, soils, rocks or composites.
Standardized methods for developing these curves exist for materials like steel or concrete, enabling unified parameters and properties for engineering comparisons, specifications and quality assurance.
compression stress- strain curve its key regions and Features
A typical curve for ductile materials like structural steel has four key regions:
- Elastic Region: The material compresses linearly following Hooke’s Law up to the proportional limit stress. The deformation is fully recoverable when unloaded.
- Yield Point: At the yield strength, material experiences first plastic deformation. Stress drops slightly and strain increases more without added stress.
- Strain Hardening: Strain increases rapidly compared to stress increase as material strengthens.
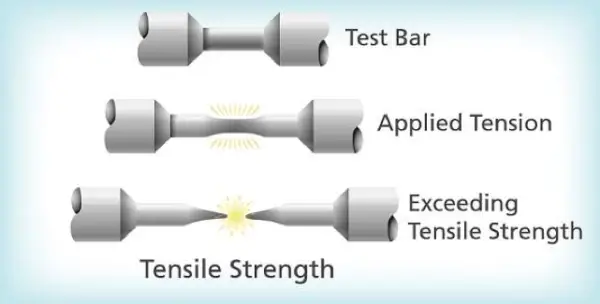
- Failure Point: The ultimate compressive strength is reached and material fractures. Stress drops suddenly while total strain is recorded.
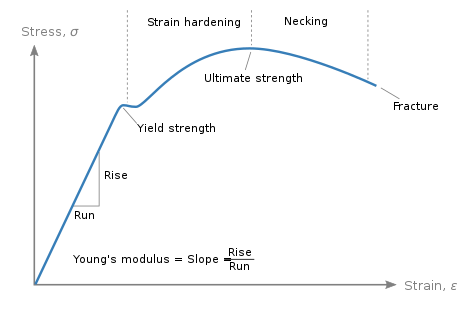
Brittle materials like concrete don’t have definitive yield points and fail shortly after reaching ultimate compressive strength.
Guidelines for Developing Compression Stress-Strain curve
Correct specimen preparation and test configurations per standards like ASTM C39 are essential for developing accurate, consistent stress-strain curves that represent the true material behavior. Key guidelines include:
• Applying axial compressive force uniformly without bending/buckling
• Checking strain readings against instrument capacity limits
• Ensuring stable, even strain rate over 5 minutes to failure typically
• Repeating tests across a sample of at least 3 specimens
Typical Curve Shapes for Various Materials
Stress-strain curve patterns differ across common civil engineering materials:
∙ Concrete: Often linear up to peak load and sudden brittle failure
∙ Clay Soil: Steep curve reflecting low strain at failure
∙ Sand Soil: More rounded curve prior to failure
∙ Structural Steel: Distinct yield point and strain hardening
The compression stress-strain curve shape indicates the ductility and provides data to calculate elastic modulus, Poisson’s ratio and more.
Generating Accurate Stress-Strain Plots for Metals
Recording systems beyond basic load cells and strain gauges are needed to capture steel’s rapid yielding and work hardening stages accurately:
• Extensometers: Measure minute strain over small gauge lengths
• Data Acquisition Software: Logs high data rate needed to plot yield
• Strain Rate Control: Prevent impact loading inducing early yield
This enables determining steel’s true stress-strain capacity.
Determining a Material’s Compressive Yield Strength
The most common techniques involve:
- Offset (Strain): 0.002 strain offset line intersects curve at yield stress
- Offset (Stress): 0.2% proof stress method
- Tangent Intersection: Draw tangent line parallel to initial straight line
Establishing repeatable, standard yield detection is critical for material specifications.
Calculating Compressive Modulus from a Stress-Strain Diagram
The modulus of elasticity (E) represents the slope of the initial, straight-line portion of a stress-strain curve. It measures material stiffness prior to yield. For civil engineering design, E is computed by:
E = (Stress Change) / (Strain Change)
Typical modulus values are:
• Structural steel: 29,000 – 30,000 ksi
• Concrete: 3600 – 5800 ksi
• Soil/Rock: 300 – 1000 ksi
Higher modulus materials are stiffer while lower values indicate flexibility.
Key Specifications for Compression Test Machines and Systems
To produce accurate stress-strain data, compression test frames and accessories require:
• Precise axial alignment and load string accessories
• Sufficient force and travel ranges
• Sensitive instrumentation and data logging
• Test procedure programming and control
• Chamber size, temperature, and humidity
Following testing codes and machine specifications ensures repeatable materials data generation and analysis.
The compression stress-strain curve relationship reveals invaluable insights on material properties for civil engineering design and quality assurance. Properly interpreting curves per structure type and using state-of-the-art testing system capabilities allows capturing the complete stress-strain signature.

