A deep understanding of the stress-strain curve is fundamental in material science, mechanical engineering, and construction.
The stress-strain curve reveals how steel, including mild steel, behaves under load, offering insights into its strength, ductility, and safety margins.
This guide will cover everything you need to know about the stress-strain curve for steel, including breakdowns for mild, carbon, and high-carbon steels.
What Is a Stress-Strain Curve?
A stress-strain curve is a graphical representation showing how a material reacts to forces that cause deformation. Stress (force per unit area) is plotted on the vertical axis, while strain (deformation per original length) appears on the horizontal axis. Analytical testing involves gradually applying a load to a steel specimen and recording how it stretches or compresses at each increment.
Stress-Strain Curve for Steel: Regions and Meaning
Steel, especially mild steel, is widely used due to its distinct mechanical properties. The stress-strain curve for steel is iconic for its clarity in showing different material behaviors.
Detailed Example: Stress-Strain Curve for Mild Steel
Let’s focus on the mild steel stress-strain curve, which is often referenced in textbooks and engineering practice.
Points on the Curve
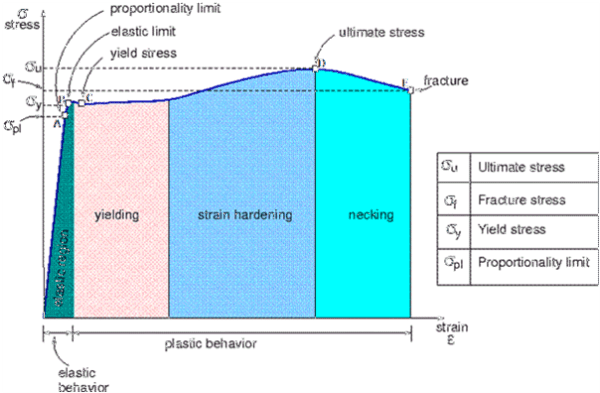
- O-A: Linear, obeys Hooke’s Law (Elastic deformation)
- A-B: Elastic limit reached—beyond this, deformations are permanent.
- B-C: Yield point zone—marked by sudden elongation with little added stress, unique to mild steel.
- C-D: Strain hardening—steel strengthens as it’s pulled further.
- D-E: Ultimate tensile point—maximum load capacity.
- E-F: Necking and fracture—material gradually thins and eventually breaks.
Characteristics
- Distinct yield plateau, significant ductility, and a clear peak followed by necking.
- Young’s modulus for mild steel is typically 210,000 MPa.
- Yield stress (lower point) is usually about 250 MPa, and ultimate strength ranges from 400 to 550 MPa for mild steel.
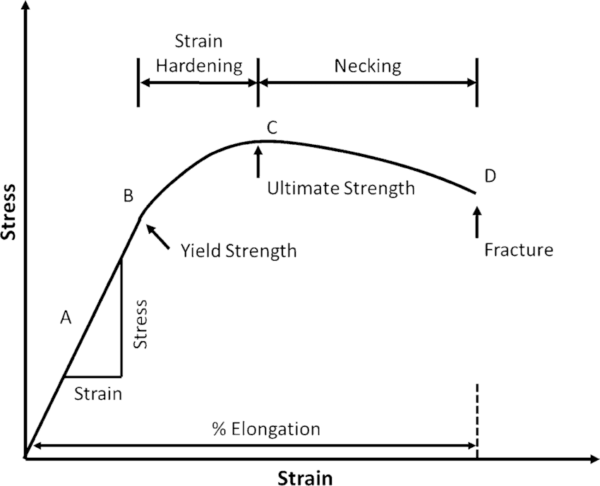
1. Proportional (Elastic) Region
- Description: In this stage, stress is directly proportional to strain (Hooke’s Law).
- Significance: The slope gives the Young’s modulus (stiffness).
- Point: Limit of proportionality—a straight, linear section up to point A.
2. Elastic Limit
- Description: The endpoint where the material can return to its original shape after removing the load.
- Relevance: Beyond this, permanent deformation begins (plastic changes).
- Point B: Elastic limit, after which plasticity starts.
3. Yield Point
- Description: The stress level where steel begins to deform with little or no increase in load.
- Features: Two yield points (upper and lower) in mild steel. The upper yield point is the onset of plasticity; the lower continues plastic flow at nearly constant stress.
4. Plastic (Strain Hardening) Region
- Description: After yield, steel stretches more easily, but the stress required rises until ultimate strength.
- Key Data Point: Ultimate tensile strength (UTS) is the peak of the curve—the maximum stress steel can withstand.
- Metals like mild steel show a slight increase in strength as they are stretched further (strain hardening).
5. Necking and Fracture
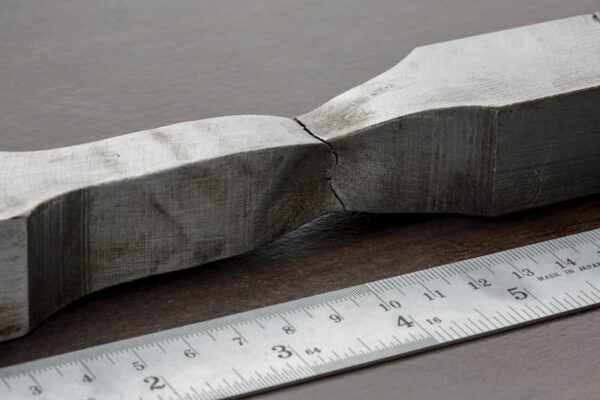
- Description: Beyond peak stress, localized narrowing (necking) starts, which induces rapid failure.
- Fracture point: Where the specimen snaps and testing ends.
- Key Fact: The area under the curve represents steel’s toughness—the energy it absorbs before failure.
Interpreting Stress-Strain Curves for Steel
A stress-strain curve plots how much a material strains, or deforms, in response to a loading force that induces stress.
For steel specifically, stress is measured in units of force per unit area, often MPa or N/mm².
Strain represents the proportional or percentage change in length of the steel from its original dimensions.
The initial straight section follows Hooke’s law, indicating elastic deformation where strain recovers upon unloading.
The slope here is the modulus of elasticity (E), or Young’s modulus, for steel, an inherent material property specifying stiffness.
The yield point is where elastic behavior transitions to plastic deformation, giving the yield strength.

In the plastic region after yielding, strain continues accumulating without additional stress, indicating permanent but ductile deformation.
Visual: Stress-Strain Diagram for Steel
The stress-strain diagram of steel is a powerful diagnostic tool. Here’s what you’ll see if you chart steel in a tensile test:
- Initial straight line (elastic zone/Young’s modulus)
- Plateau at yield (unique to mild steel)
- Rising curve (strain hardening)
- Peak (ultimate strength)
- The steel undergoes a rapid decrease in strength due to fracture.
The highest point reached is the ultimate tensile strength (UTS).
Finally, the material can no longer withstand additional strain, breaking at the fracture point.
This curve visualizes the steel grade’s strength, ductility, toughness, and other mechanical capabilities.
Higher strength grades have higher stresses at initial yielding and fracture points, while more ductile grades accommodate more deformation without cracking.
Stress-Strain Curve Forms for Different Steels
1. High Carbon Steel Stress-Strain Curve
- High carbon steel is more brittle than mild steel.
- The yield plateau is less noticeable; it has a higher ultimate strength, but it breaks down at lower strain.
- Steel is utilized in springs and cutting tools.
2. Stainless Steel Stress-Strain Curve
- Exhibits pronounced strain hardening; the Ramberg–Osgood equation is often used for modeling.
- Corrosion-resistant applications use stainless steel due to its higher ductility and work-hardening range.
3. Carbon Steel Stress-Strain Curve
- Properties depend on carbon content—lower carbon means more ductility; high carbon steel is stronger but less ductile.
Stress-Strain Diagram Steel Meaning
Analyzing stress-strain diagrams is key to selecting appropriate steel types and designing safe, optimal structural components.
For instance, steel selected for earthquake resistance prioritizes strength and especially ductility to endure repeated cyclic strains.
Conversely, brittle high-carbon steels prone to shattering under lower strains are unsuitable for earthquake zones despite their high strength.
Matching steel grade properties on stress-strain curves to intended loading and deformation requirements is crucial in civil engineering design.
Reading Stress-Strain Graphs for Steel
Correctly interpreting stress-strain diagrams for steel requires identifying key elements:
- Elastic modulus—slope of initial linear section
- Yield strength—stress at transition from elastic to plastic behavior
- Ultimate strength—maximum stress sustained
- Fracture strength—breaking stress capacity
- Total elongation—Strain at fracture representing ductility
Considering these vital points on the graph enables appropriate steel selection and design calculations using actual measured mechanical properties instead of mere rated strengths.
Steel Stress-Strain Graph Analysis
Beyond reading key points on the graph, analysis techniques help gain further insights.
For example, integrating the area under the stress-strain curve estimates resilience, or the energy absorption capacity of the steel grade.

This predicts actual energy dissipation under stresses like blast loads.
Trends in repeated stress-strain curves can detect cyclic strain hardening or softening under conditions causing fatigue over time.
Detailed analytical study of steel stress-strain behavior informs optimal usage specifications and safety factors in infrastructure design codes protecting human life.
Stress-Strain Curve for Steel Pipe
Custom stress-strain analysis applies to specialized steel structural forms like pipes frequently used in civil engineering and construction.
Factors like seam types (electric resistance welded or seamless), pipe diameters, and production processes can influence properties.
Standards provide code-compliant reference curves for common piping grades.
But further material-specific testing establishes precise performance data for critical applications.
This ensures pressure vessels and penstocks endure stresses within safe limits.
Stress-Strain Relationship Steel Correlation
The characteristic stress-strain curve shape directly correlates to underlying steel microstructure and compositions.
Factors like production method, presence of alloys, heat treatment, and mechanical working create diverse atomic arrangements and interactions.
These influence intermolecular bond strengths and deformability within the crystallite structures responding to external stresses.
Understanding these metallurgical factors provides deeper insight into manipulating steel compositions and treatments to achieve tailored mechanical properties per application requirements.
Tensile Test Steel Stress-Strain Values
The most direct method for obtaining accurate stress-strain data uses standardized tensile testing procedures.
This applies controlled tension forces to a steel sample, measuring deformation using extensometers attached to the gauge length.
Plots of the evolving test load versus elongation in this setup construct the stress-strain curve.
Tensile testing generates the empirical curve with directly measured stresses and strains reflecting in situ steel performance.
Required parameters also include the precise steel chemistry, processing history, specimen dimensions and orientation, strain rate controls, and environmental conditions accurately simulating service settings.
Stress-Strain Curve Steel Comparison Materials
Steel has a distinct stress-strain signature differentiating it from other construction metals like aluminum or titanium alloys.
Steel outperforms aluminum under equivalent strains once past the yield point.

But lighter aluminum withstands higher strains initially in the elastic zone, making it suitable for flexural loading.
Steels have a well-defined yield point transition after which large deformations continue uniformly.
More brittle metals exhibit fractures just beyond initial yielding, requiring designers to always keep stresses within elastic limits for safety.
These relative behavior contrasts guide optimal, fit-for-purpose material selections.
5 FAQs About Stress-Strain Curve
What is a stress-strain curve?
A stress-strain curve is a graphical representation that shows how a material deforms (strain) as a force (stress) is applied to it. It plots stress on the vertical axis and strain on the horizontal axis, revealing the relationship between these two fundamental properties of materials
Why is the stress-strain curve important in engineering?
The stress-strain curve helps engineers determine critical material properties such as elasticity, yield strength, ductility, ultimate tensile strength, and fracture point. These properties are essential to ensure structures are safe and materials are suitable for specific applications
What are the main regions of a typical stress-strain curve?
A standard stress-strain curve has several key regions:
Hooke’s law applies in the proportional (linear) region, where stress and strain are directly proportional.
Beyond the elastic limit, the material cannot revert to its initial form.
The yield point marks the beginning of permanent (plastic) deformation.
Ultimate tensile strength is the maximum stress the material can handle.
Fracture point, where the material breaks.
How do you interpret the properties derived from the stress-strain curve?
How is a stress-strain curve measured or plotted?
Factors Affecting Steel Stress-Strain Behavior
Many interdependent influences modulate steel stress-strain performance:
- Chemical composition—carbon and alloying content
- Microstructure—Crystalline phases like ferrite, martensite
- Mechanical working—rolling, forging processes
- Heat treatment—quenching and tempering for enhanced properties
- Specimen parameters—dimensions, orientation, surface finish quality
- Test conditions—strain rates, environments simulating service
Computational modeling, coupled with physical simulation, now predicts steel performance under diverse loading conditions based on first principles.
But fundamental experimental stress-strain analysis continues providing empirical data guiding safety-centric design.
Evaluating complex interacting factors governing steel stress-strain behavior remains an active research area as infrastructural demands evolve.
This covers key aspects of understanding and applying the vital engineering information embedded in the stress-strain curve signature of steel.
Correct interpretation guides appropriate steel grade selection and design calculations, ensuring structural reliability over decades of service.
Relevant stress-strain data enables balancing performance, safety, and economics in advancing civil engineering infrastructure.
Conclusion: Mastering the Stress-Strain Curve
Whether you’re an engineer or a student, understanding the stress-strain curve for steel is vital. It helps you analyze mechanical performance, design safer structures, and select optimal materials for your needs.
For mild steel, the classic stress-strain curve defines modern structural engineering. The nature of the steel stress vs. strain curve changes across steel grades, but they all offer comprehensive observations about safety, ductility, and ultimate strength.


