It illustrates the relationship between stress and strain for a material like concrete.
It provides valuable information about the material’s properties and behavior under load. For concrete, the stress-strain curve is essential for structural design and analysis. This article will provide a comprehensive overview of stress-strain relationships for concrete.
What is a Stress-Strain Curve?
A stress-strain curve shows the stress (force per unit area) on the vertical axis and the resulting strain (deformation) on the horizontal axis. It demonstrates how a material deforms under an applied load.
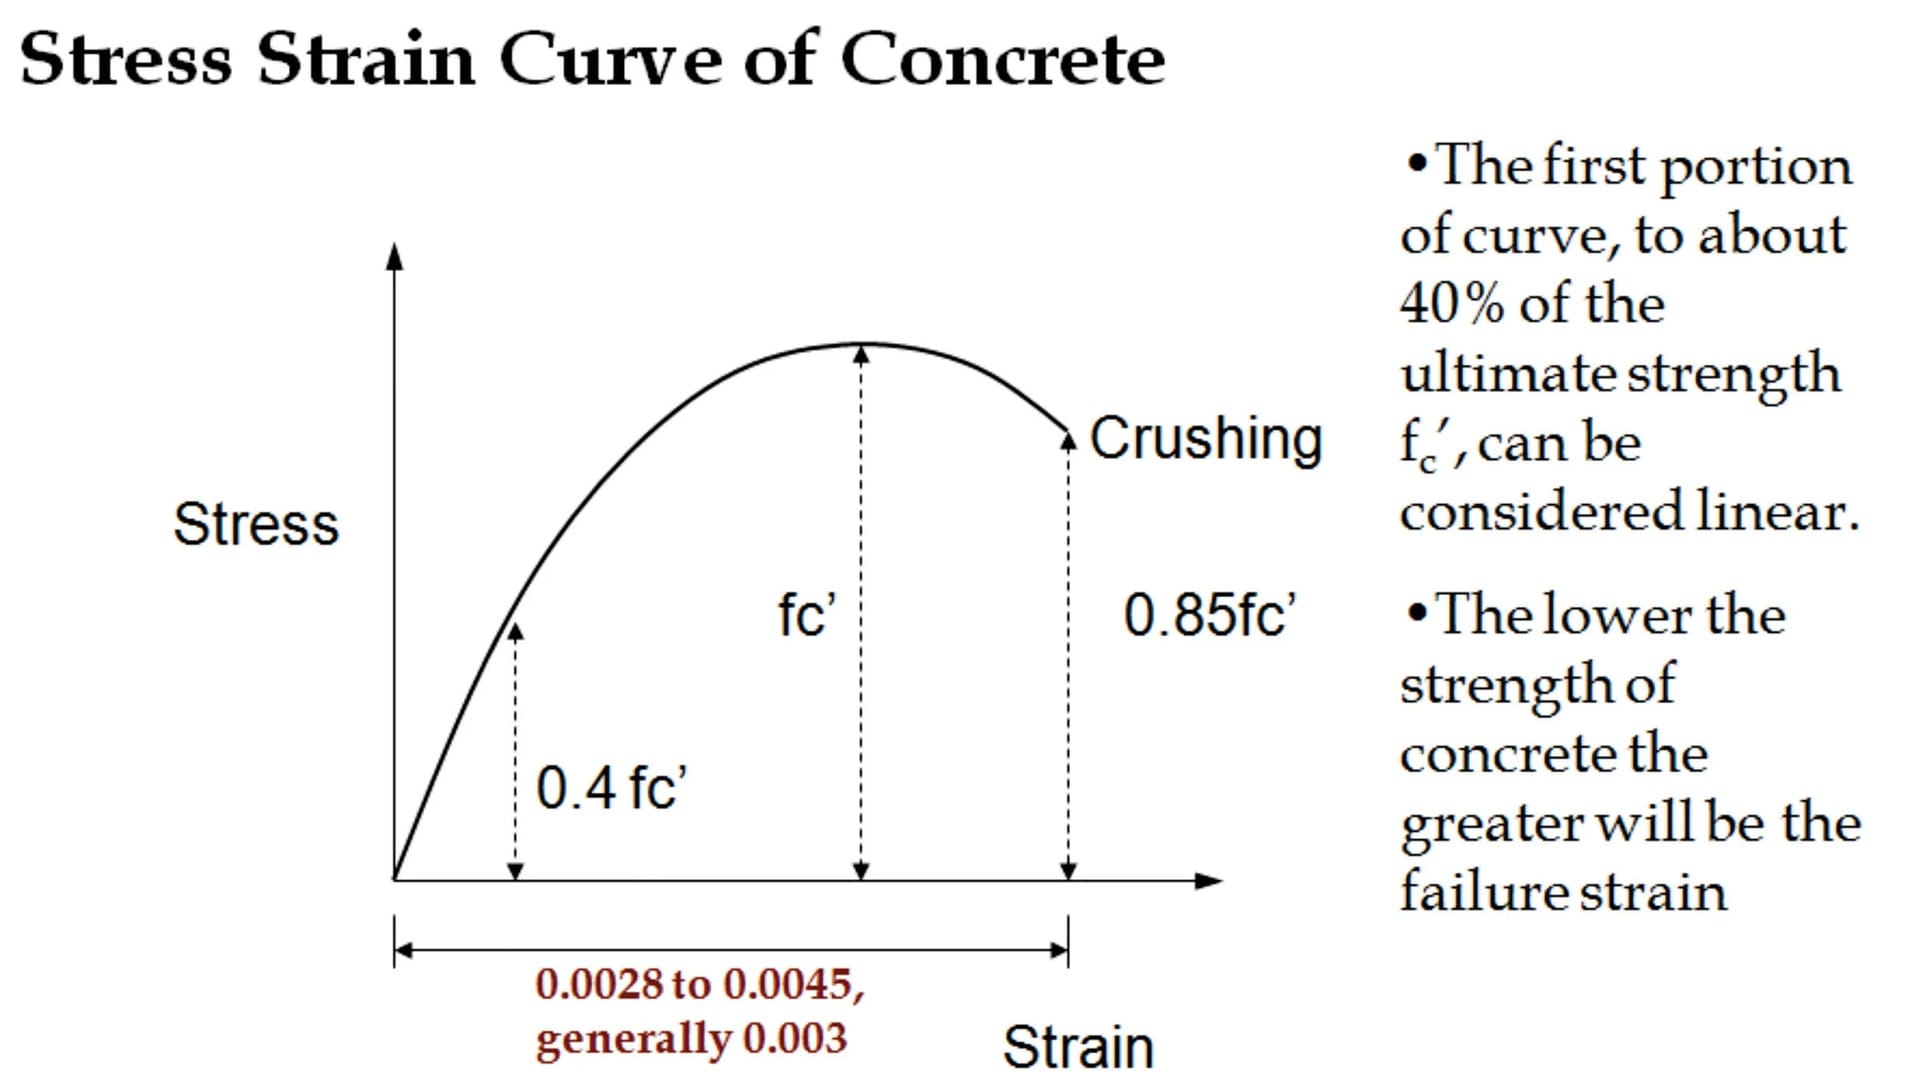
The initial part of the curve is linear elastic, where stress is directly proportional to strain. At higher stresses, the curve becomes nonlinear as concrete starts to crack and crush.
The slope of the initial straight portion of the curve gives the elastic modulus or modulus of elasticity (E) of concrete. This indicates the material’s stiffness – its resistance to deformation. The stress-strain diagram also shows the yield point, ultimate strength, and rupture point of concrete.

Stress-Strain Relationship for Concrete in Compression
Concrete is very strong in compression but weak in tension.
The compressive stress-strain curve for concrete shows an initial linear elastic region, followed by a nonlinear region up to failure. The stages are:
1. Elastic deformation: Up to 30-40% of ultimate strength, the curve is linear. Stress and strain are proportional. The slope is the modulus of elasticity E.
2. Microcracking: Tiny internal cracks develop at around 30-50% of ultimate strength. Stiffness starts decreasing.
3. Plastic flow: The material starts crushing and flowing plastically before peak strength. Strains increase rapidly with little increase in stress.
4. Ultimate strength: The highest stress concrete can withstand. The curve reaches a peak compressive strength.
5. Fracture: Concrete crumbles in a brittle manner after exceeding ultimate strength. Stress drops suddenly as fracturing occurs.
The compressive strength and elastic modulus of concrete are important parameters derived from this curve. Typical values are 25 MPa to 80 MPa for strength and 14 GPa to 41 GPa for E.
Difference in Stress-Strain Curve for Concrete and Steel
While both concrete and steel are construction materials, their stress-strain curves differ significantly:
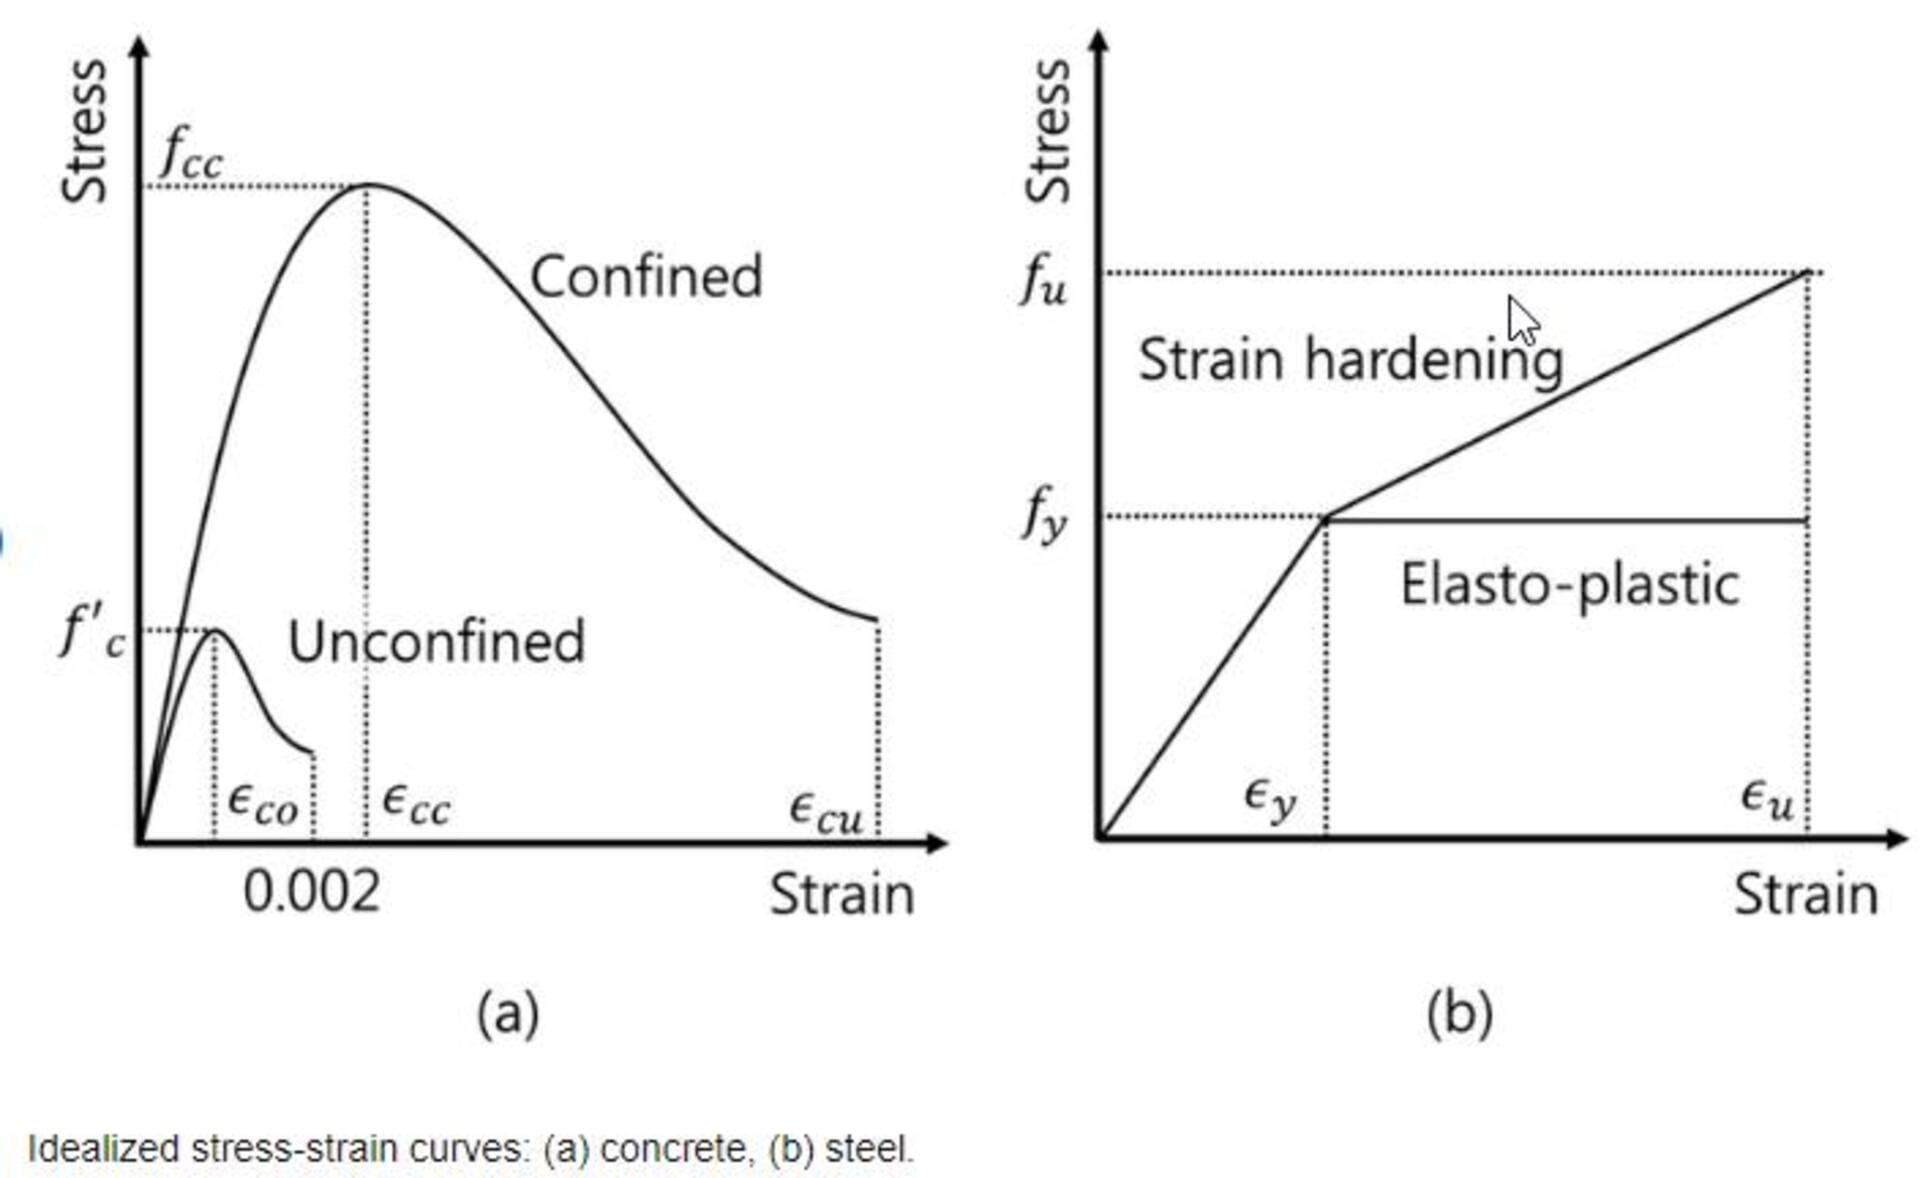
- Concrete exhibits a parabolic curve with a well-defined peak compressive strength. Steel has a linear elastic region up to yielding, after which it shows plastic deformation.
- Concrete crushing is brittle while steel fracture is ductile. Concrete breaks suddenly but steel deforms plastically first.
- Concrete is weak in tension but very strong in compression. Steel has almost equal tensile and compressive strength.
- The slope of the elastic region gives concrete’s modulus of elasticity E. For steel, E is constant rather than changing with stress.
- Concrete shows microcracking and nonlinear behavior before peak. Steel remains linear up to yield point.
- For concrete, the descending branch depicts brittle fracture. For steel, strain continues increasing in the plastic region.

Thus, concrete and steel stress-strain curves vary based on the different nature of the materials. Their distinct properties must be considered in design.
Generating Stress-Strain Curve for Concrete from Tests
The stress-strain response of concrete is determined experimentally through compression testing of concrete cylinders or cubes. The test methods include:
- Uniaxial compression test: Axial compressive load applied on cylindrical or cubical samples until failure. Stress-strain readings taken.
- Flexure test: Concrete beam/slab loaded in bending till failure. Indirect tensile stresses calculated from flexural strains.
- Splitting tensile test: Cylinders loaded diametrically in compression to induce transverse tensile failure.
Plotted results from the above tests generate the entire stress-strain curve for concrete in compression, tension, and bending. Testing is done per standards like ASTM C39, C78, and C293. Proper sample preparation and test procedures are critical for accurate curves.
Understanding the Stages of a Stress-Strain Curve for Concrete
As explained before, a concrete stress-strain curve under compression can be divided into distinct stages:
Elastic region: Stress is proportional to strain in this initial linear portion. The slope equals the modulus of elasticity E.
Microcracking: Nanocracks develop inside concrete, causing nonlinearity and decreasing stiffness.
Inelastic flow: Concrete crushes and flows plastically. Strain increases rapidly with little gain in stress.
Peak strength: Maximum stress concrete can take in compression. Strength depends on mix design and curing.
Descending branch: Concrete fractures and breaks down suddenly after exceeding peak strength.
Residual strength: In some cases, concrete retains shear capacity at large strains after the peak.
Identifying the stages helps in analyzing concrete structural behavior up to failure. The nonlinear transitions have to be appropriately modeled.
Factors Affecting the Shape of a Concrete Stress-Strain Curve
The shape and key points of the concrete stress-strain diagram are influenced by:
- Water-cement ratio – Higher w/c ratio decreases strength and elastic modulus.
- Aggregate properties – Stiffer aggregates increase concrete E.
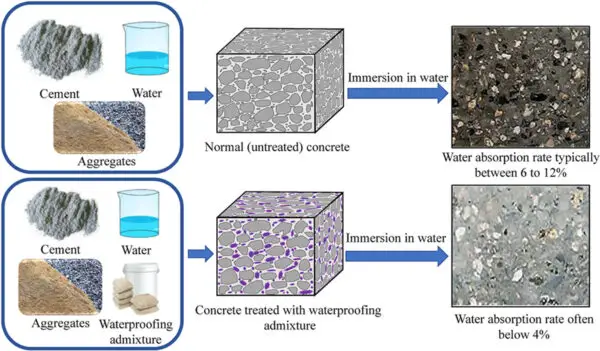
- Admixtures – Mineral admixtures like silica fume improve strength.
- Curing – Moist curing increases strength and stiffness.
- Loading rate – Faster rates give higher apparent E and strength.
- Sample size – Smaller diameters give higher measured strengths.
- Testing method – Uniaxial, flexural, and splitting tests give slightly varied curves.
- Age – Concrete gains strength and stiffness with age due to curing.
- Stress state – Tensile curves differ from compressive curves.
Thus, the actual curve depends on concrete mix proportions, curing, sample variables, and test methods.
Stress-Strain Behavior of Concrete under Flexural Loading
Flexural loading causes non-uniform compression, tension, and shear stresses across a concrete beam’s depth.
The stress-strain response differs from uniaxial compression:
- Initially linear elastic behavior is followed by cracking at the tensile face.
- After cracking, the beam exhibits nonlinear deformation with reduced stiffness.
- The top fibers compress beyond peak compressive strength while bottom fibers are in tension.
- Strain distribution becomes nonlinear across the depth as loading advances.
- Ductile steel reinforcement allows large deflections after concrete cracking in flexure.
- Shear cracking may occur due to principal tensile stresses near supports.
Thus, flexural stress-strain curves depict a ductile post-peak response for reinforced concrete beams until steel yields. The ductility arises from concrete cracking and steel elongation.
Methods for Determining the Stress-Strain Curve of Concrete
Some ways by which the complete stress-strain diagram for concrete can be established experimentally are:
- Uniaxial compression test – Gives the compressive behavior up to peak strength. Requires accurate alignment.
- Split cylinder tensile test – Used to determine the tensile strength and strain capacity.
- Flexural testing of beams – Provides tensile and compressive response under bending.
- Indirect tensile testing – Tensile strains are calculated from applied compression on cylinders.
- Triaxial compression – Allows determining the influence of confining pressures on strength.
- Modal analysis – Dynamic testing to obtain stiffness degradation parameters.
- Fracture energy testing – Involves measurement of the work required to cause failure.
A combination of the above tests is required for constructing the full concrete stress-strain profile.
Stress-Strain Models for Concrete in ABAQUS/ANSYS
Advanced finite element software like ABAQUS and ANSYS require appropriate stress-strain models to simulate concrete behavior accurately:
- The elastic region is modeled by defining the elastic modulus E.
- The microcracking zone can be modeled via the smeared crack approach.
- The plastic region is captured using plasticity models like the Drucker-Prager criteria.
- The fracture zone is simulated using crack propagation techniques and fracture energy.
- The tensile region is modeled using tension stiffening and tension softening approaches.
- The cyclic response is incorporated using models like the concrete damaged plasticity model.
- Parameters are defined from the experimental stress-strain curve for input to the model.
Accurate FE analysis of concrete structures relies on proper implementation of the salient points on the stress-strain diagram.
Differences Between Stress-Strain Curve for Various Concrete Grades
Higher strength concrete grades exhibit higher elastic moduli and peak stresses compared to lower grades:
- Modulus of elasticity (E) – Increases with compressive strength as E (GPa) ≈ 4700√f’c.
- Proportional limit – Higher for stronger concrete indicating increased resistance to microcracking.
- Peak compressive strength – Defines the grade, i.e. M20, M30, etc. Stronger grades have higher peaks.
- Strain at peak stress – Higher strength concretes experience brittle failure at lower peak strains.
- Post-peak ductility – Weaker concretes show longer plastic plateaus after the peak.
Thus, high strength concrete stress-strain diagrams have steeper elastic slopes, higher peaks, and smaller failure strains compared to normal strength concrete.
Creating Bi-linear Approximations from Concrete Stress-Strain Data
For simplified analytical calculations, the ascending nonlinear concrete stress-strain curve is often approximated as two straight lines:
- The initial elastic portion is represented by a line between the origin and a point at 40-60% of peak stress.
- The plastic region is depicted by a horizontal line at the peak compressive strength.
This bi-linear model captures the main features of the curve – the elastic modulus E, yield point, and maximum strength. It allows using simple linear elastic and plastic principles for analysis.
While easier for calculations, the bi-linear approximation loses accuracy in modeling the gradual nonlinearity of concrete behavior. Advanced analytical methods use multi-linear models or curve-fitting to improve representation of the test data.
Using Stress-Strain Curve to Calculate Modulus of Elasticity of Concrete
The initial linear elastic portion of the stress-strain diagram is utilized to calculate concrete’s modulus of elasticity (E).
- The slope of this region gives E directly. It equals stress/strain at 40-50% of peak stress in psi or MPa.
- Empirical relations have been developed correlating E to the compressive strength f’c.
- For normal weight concrete, E (GPa) ≈ 4700√f’c (MPa).
- Another approximation is E (GPa) = (0.043ρ^1.5) √f’c (MPa).
- E can also be calculated from the concrete’s density and elastic moduli of aggregates.
Accurate determination of E is important for estimating deformations in concrete members using stress-strain-based analysis.
Conclusion
The stress-strain curve provides a wealth of information about concrete’s behavior under various types of loads. It forms the backbone for analytical methods as well as advanced nonlinear finite element modeling of concrete structures.
Careful testing and generating the complete curve including tensile regions leads to realistic material characterization.
With increasing construction of high-rise buildings and long-span bridges with concrete, understanding and accurately representing its stress-strain properties are becoming more crucial than ever.


